BE THE FIRST TO KNOW
Enter your email below to subscribe to the QLA newsletter to receive timely updates from your favorites products.
When looking to increase the sample loading on a column, there are a number of factors to consider:
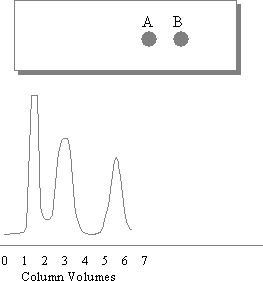
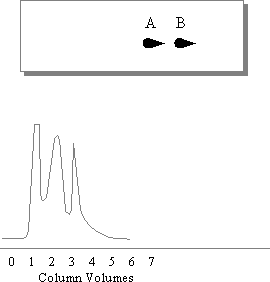
The diagrams below show the effect of mass on sample resolutions. This illustrates how increased sample loading results in poorer separations.
 |
 |
|
1mg Sample |
10mg Sample |
| CV | Sample Load |
| 1 | 250mg-1g |
| 2 | 1-2g |
| 6 | 2-5g |
It is possible to predict sample loading based upon the difference in CV values. The table on the right shows an example of such a prediction when using a 40x150mm silica cartridge.
By carefully choosing the solvent, you can maximise the number of column volumes the sample is eluted in and so maximise the sample loading.